Analytics

Phosphate Reserves in Different Countries Worldwide

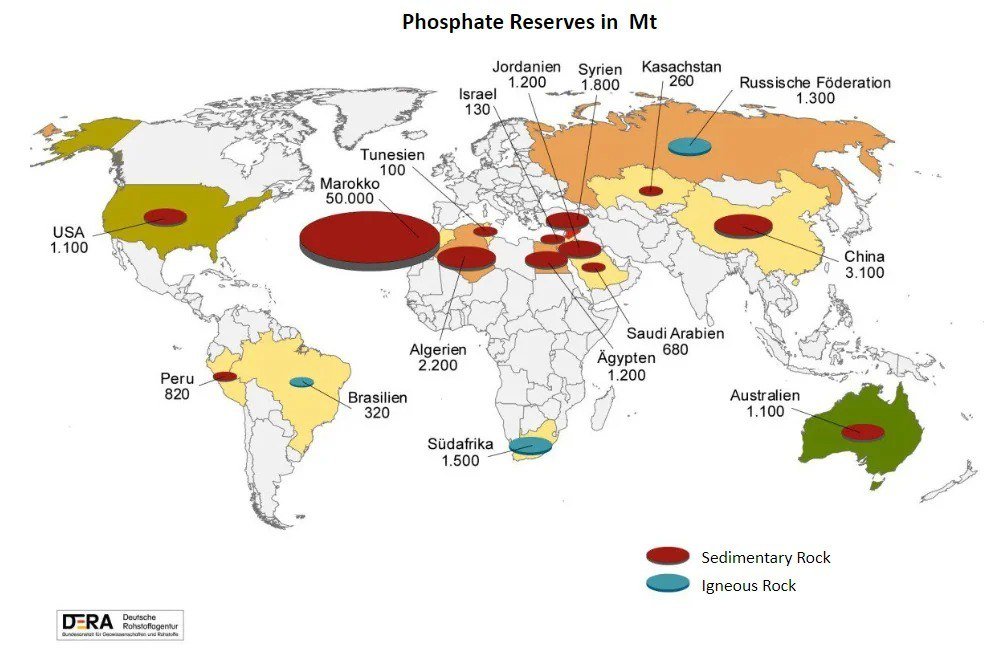
Phosphate Reserves in Different Countries Worldwide Phosphates are essential for producing phosphorus fertilizers, crucial for modern agriculture. The largest phosphate reserves globally are found in Morocco, totaling around 50 billion tons. In comparison, China follows with 3.1 billion tons, and Algeria ranks third with 2.2 billion tons. Other countries with significant phosphate reserves include Egypt, Jordan, the USA, and Australia, each holding slightly over 1 billion tons. These reserves play a vital role in sustaining agricultural production worldwide.


Languages of the Indo-European Family in Global Distribution

Languages of the Indo-European Family in Global Distribution Indo-European languages have a notable presence worldwide, with Romance and Germanic languages collectively dominating regions like the Americas, Australia, and the majority of Europe. Additionally, Slavic languages hold influence over the entire northern expanse of Eurasia. Indian languages are also part of the Indo-European language family, alongside numerous languages spoken in the Middle East.


Global Variances in Feeling Loved

Global Variances in Feeling Loved People in Central Asia (including Mongolia) and Morocco report feeling the least loved. Conversely, residents of the CIS countries express love slightly more frequently, though still relatively infrequently, with around 50% of respondents indicating so. On the other hand, Hungary and both Americas stand out with a significant portion of their populations stating that they feel loved.


Average GDP Growth Rates of Different Countries in the World from 2013-2025

Average GDP Growth Rates of Different Countries in the World from 2013-2025 On average over these 12 years, our real GDP increased by 1.5% per year - quite a European level! In Germany, this indicator is an average of 0.9% per year, in France - 1.1%. However, the GDP (per capita) there was noticeably higher in 2013 (and remains so now) than ours... Yet we are far behind, for example, compared to India (average +6.2% per year) and China (+5.9% per year), or even more so to Guyana with its average of +18.3% per year over 12 years (an increase almost 8 times during the period)! The main laggards are Venezuela (averaging -8% per year over 12 years...), both Sudans, Yemen, Ukraine, and Afghanistan.


Where GPS is "Blocked" in the World

Where GPS is "Blocked" in the World On the map, navigation quality assessments from aircraft show areas where GPS functions properly in green, while disruptions are indicated by yellow-orange-red colors. Regions where non-internationally registered aircraft do not operate are left blank. Despite these areas, the map reveals intriguing patterns. Significant global GPS blocking zones include the borders of western Russia, areas surrounding Ukraine (especially near its western borders), and the northern part of the Black Sea, where both conflicting sides likely block GPS signals. Navigation poses challenges in the Middle East, particularly around Israel and Iran. GPS issues are also present in Southeast Asia (near Myanmar), isolated locations in Africa, and sporadically in Latin America.


The Major "Bottlenecks" of Global Oil Supplies

The Major "Bottlenecks" of Global Oil Supplies The global oil supply chain faces critical bottlenecks at the Strait of Malacca and the Strait of Hormuz, where millions of barrels of oil transit daily. These two points are the most strategic locations for disrupting oil supplies, with 23.2 million and 20.9 million barrels passing through each day, respectively. In comparison, other points along the supply chain handle less than 10 million barrels daily. Considering global oil consumption at 104.4 million barrels per day and global maritime trade at 79.8 million barrels, blocking the vital chokepoint of the Strait of Hormuz could have a significant impact. However, the potential consequences of blocking the Malacca Strait, which would have an even more substantial effect, are limited by the geographic distance from Iran.


The Evolution of Web Browsers: 2012 vs 2022

The Evolution of Web Browsers: 2012 vs 2022 In 2012, the web browser landscape showcased a diverse range of options. Fast forward to 2022, Chrome has emerged as the dominant force globally, with only Greenland favoring Safari among "Apple users" and parts of Africa opting for Microsoft Edge. A notable shift in browser preferences over the past decade highlights Chrome's near-universal popularity, leaving a few regions standing out with their browser choices.


Minimum Legal Drinking Age Varies Across Countries

Minimum Legal Drinking Age Varies Across Countries In most countries worldwide, alcohol sales typically start at the age of 18-19, similar to regulations in our country. However, 19 countries globally have no age restrictions at all, including select Asian, African, and Latin American nations where the minimum age can be as low as 15 years old. Some European countries allow the purchase of certain alcoholic beverages from as young as 16-17. In contrast, the United States enforces a notably higher minimum legal drinking age of 21, a policy also adopted by Mongolia, Iraq (despite being predominantly Muslim, unlike its neighboring countries where alcohol is often prohibited), and various other locations around the world.


Brands that lost the most value last year

Brands that lost the most value last year The automotive sector took a hit last year, with Tesla leading the pack with a $15 billion loss in brand value. German brands like Mercedes-Benz and Porsche followed closely, each losing $6 billion, while Mitsubishi suffered a $4 billion decrease. The Chinese automotive industry played a significant role in these losses. Chinese businesses faced challenges as well, especially in the banking sector, where a Chinese bank ranked second overall with a $7 billion loss, along with struggles in the construction industry. Luxury goods manufacturers like Louis Vuitton and Chanel also saw a decline in brand value, adding to the list of top devaluations.


Oil Production Dominance in North America

Oil Production Dominance in North America North America stands out as the leading region for oil extraction globally, contributing 29.9% of the total production. In comparison, the Middle East follows closely behind with a 29.1% share, while Eurasia lags significantly at only 12.8%, predominantly represented by countries like Kazakhstan and Azerbaijan. Surprisingly, the United States has quietly emerged as a frontrunner in oil production, showcasing significant growth and dominance in this industry.